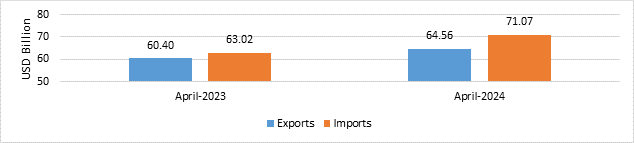
India’s total exports (Merchandise and Services combined) in April 2024* is estimated to be USD 64.56 Billion, exhibiting a positive growth of 6.88 per cent over April 2023.
Further, total imports (Merchandise and Services combined) in April 2024* is estimated to be USD 71.07 Billion, exhibiting a positive growth of 12.78 per cent over April 2023.
Table 1: Trade during April 2024*
| April 2024
(USD Billion) |
April 2023
(USD Billion) |
||
| Merchandise | Exports | 34.99 | 34.62 |
| Imports | 54.09 | 49.06 | |
| Services* | Exports | 29.57 | 25.78 |
| Imports | 16.97 | 13.96 | |
| Total Trade
(Merchandise +Services) * |
Exports | 64.56 | 60.40 |
| Imports | 71.07 | 63.02 | |
| Trade Balance | -6.51 | -2.62 |
* Note: The latest data for services sector released by RBI is for March 2024. The data for April 2024 is an estimation, which will be revised based on RBI’s subsequent release.
Fig 1: Total Trade during April 2024*
MERCHANDISE TRADE
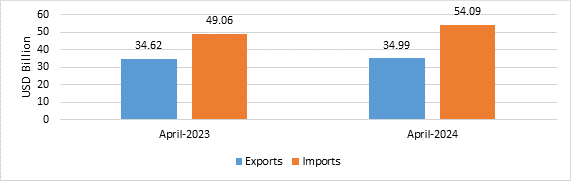
- Merchandise exports in April 2024 were USD 34.99 Billion, as compared to USD 34.62 Billion in April 2023.
- Merchandise imports in April 2024 were USD 54.09 Billion, as compared to USD 49.06 Billion in April 2023.
Fig 2: Merchandise Trade during April 2024
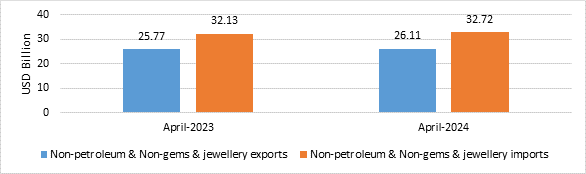
- Non-petroleum and non-gems & jewellery exports in April 2024 were USD 26.11 Billion, compared to USD 25.77 Billion in April 2023.
- Non-petroleum, non-gems & jewellery (gold, silver & precious metals) imports in April 2024 were USD 32.72 Billion, compared to USD 32.13 Billion in April 2023.
Table 2: Trade excluding Petroleum and Gems & Jewellery during April 2024
| April 2024
(USD Billion) |
April 2023
(USD Billion) |
|
| Non- petroleum exports | 28.37 | 28.20 |
| Non- petroleum imports | 37.63 | 35.36 |
| Non-petroleum & Non Gems & Jewellery exports | 26.11 | 25.77 |
| Non-petroleum & Non Gems & Jewellery imports | 32.72 | 32.13 |
Note: Gems & Jewellery Imports include Gold, Silver & Pearls, precious & Semi-precious stones
Fig 3: Trade excluding Petroleum and Gems & Jewellery during April 2024
SERVICES TRADE
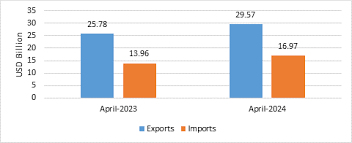
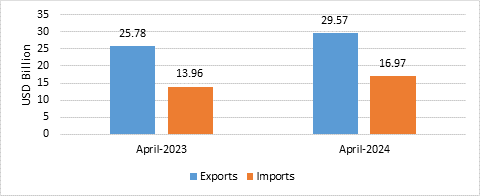
- The estimated value of services export for April 2024* is USD 29.57 Billion, as compared to USD 25.78 Billion in April 2023.
- The estimated value of services import for April 2024* is USD 16.97 Billion as compared to USD 13.96 Billion in April 2023.
Fig 4: Services Trade during April 2024*
- In merchandise exports, 13 of the 30 key sectors exhibited positive growth in April 2024 as compared to same period last year (April 2023). These include Electronic Goods (25.8%), Tea (25.74%), Organic & Inorganic Chemicals (16.75%), Coffee (15.87%), Tobacco (13.22%), Spices (12.27%), Drugs & Pharmaceuticals (7.36%), Cotton Yarn/Fabs./Made-Ups, Handloom Products etc. (6.65%), Carpet (5.64%), Cereal Preparations & Miscellaneous Processed Items (5.33%), Petroleum Products (3.1%), Plastic & Linoleum (2.99%) and Handicrafts Excl. Hand Made Carpet (2.36%).
- In merchandise imports, 14 out of 30 key sectors exhibited negative growth in April 2024. These include Sulphur & Unroasted Iron Pyrites (-71.75%), Pearls, Precious & Semi-Precious Stones (-21.12%), Cotton Raw & Waste (-16.31%), Wood & Wood Products (-14.11%), Coal, Coke & Briquettes, etc. (-11.71%), Artificial Resins, Plastic Materials, etc. (-10.26%), Fertilisers, Crude & Manufactured (-8.3%), Iron & Steel (-8.28%), Chemical Material & Products (-7.69%), Organic & Inorganic Chemicals (-5.19%), Machinery, Electrical & Non-Electrical (-3.54%), Dyeing/Tanning/Colouring Materials (-2.63%), Pulp and Waste Paper (-2.2%) and Transport Equipment (-0.22%).
- Services exports is projected to grow by 14.68 percent during April 2024 over April 2023.
Source: https://pib.gov.in/